 Form & Data
Speed Figures Explained: How Fast Is Fast?
Raw race times mean little until you correct them for course, ground and race shape. This guide explains how speed figures do exactly that — from Phil Bull's Timeform to Andrew Beyer and modern automated ratings — and how to read a figure without being fooled by it.
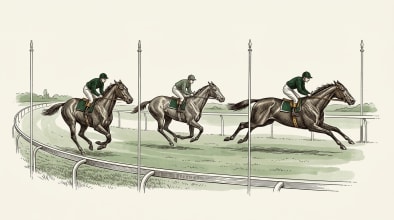
On Derby day in June 2012, an unheralded four-year-old called Stone Of Folca won the Epsom Dash in 53.69 seconds — five furlongs at an average of nearly 42mph, and a time recognised by Guinness World Records as the fastest ever run over the distance. It is a lovely piece of trivia, and read carelessly it is a misleading one, because the record owes almost as much to geography as to the horse. Epsom's sprint course drops steeply from the start — billed as the fastest five furlongs in the world — and the ground that afternoon was quick. Nobody seriously argues that Stone Of Folca was the fastest racehorse who ever lived.
That is the trouble with the raw clock. Every result in Britain and Ireland arrives with a final time attached, and almost none of us can read one unassisted. Is a mile in 1 minute 38 seconds good? It depends where it was run, what the ground was doing, how the wind blew, what weight the horse carried, and whether the field dawdled for half the race or went hard from flagfall. A raw time is an answer without its question.
Speed figures exist to supply the question. A figure takes the time a horse actually recorded and corrects it — for the course, for the day's conditions, for the weight on its back — until what remains is a single number you can compare across courses, distances and months. This guide covers where figures came from, how a modern one is built, and how to read one without falling for the classic traps.
Why the raw clock lies
Consider seven furlongs at Ascot and seven furlongs at Catterick. On paper they are the same test; in reality they are barely the same sport. Ascot's seven is dead straight, wide and galloping, rising for much of its length to a punishing final climb from around the two-furlong marker. Catterick's is run on a sharp, undulating, left-handed oval barely nine furlongs round, and nearly every yard from the start to the winning post is downhill. A modest handicapper at Catterick can record a time that would flatter a smart performer at Ascot, and neither clock has lied. They have answered different questions.
Then there is the ground. Timeform, whose time archive reaches back to 1933, notes that really heavy going can add as much as ten seconds to the time horses record over five furlongs. At the five-lengths-per-second scale the judge uses on soft ground, ten seconds is a gap of fifty lengths — from the surface alone. It is why understanding the going comes before reading any time.
And then there is pace. Races are contests, not time trials, and a slowly run contest produces a slow time however brilliant the winner. Speed figures are the craft of untangling all three — course, ground and race shape — from what the clock saw.
A short history: Halifax before Washington
Ask an American who invented speed figures and you will hear the name Andrew Beyer. Britain got there first. Phil Bull, a Yorkshireman with a mathematics degree from Leeds, spent the 1940s selling time-based assessments of racehorses by post under a pseudonym, and in 1948 turned the sideline into a company. Timeform — founded in Halifax with his collaborator Dick Whitford, the name a marriage of Bull's clock and Whitford's form study — published Racehorses of 1948, the first of its famous annuals.
Bull expressed his ratings in pounds, and Britain still does: a horse rated 130 is reckoned ten pounds superior to one rated 120, meaning the lesser animal would need to receive ten pounds in weight for the pair to finish level. It is a practical scale, because weight is the currency the sport already trades in — if that jargon is new, our guide to how handicap ratings work starts from first principles. On the Timeform scale, Frankel's 147 in 2012 remains the highest rating the firm has ever given a Flat horse; Arkle's famous 212 belongs to a separate steeplechasing scale, never compared with the Flat one.
The American chapter came a generation later. Beyer, racing columnist of the Washington Post, began experimenting with figures around 1970 and set out his method in Picking Winners in 1975. The book turned time analysis into a public discipline, and from 1992 the Daily Racing Form printed a Beyer Speed Figure with every past performance. Britain's daily equivalent is Topspeed, the Racing Post's time-based rating, printed in pounds beside its form-based sibling, RPR.
That pairing captures the one distinction worth memorising. Performance ratings — official marks, RPRs, Timeform's master ratings — are built from collateral form: who beat whom, by what margin, at what weights. Speed figures are built from the clock. The two usually agree; when they disagree, one of them knows something the other does not, and finding out which is where form study gets interesting.
How a modern speed figure is built
Every compiler has private refinements, but the skeleton has been common property since Halifax in 1948.
- Standard times. For every course and distance, a baseline: roughly, the time a good horse records on good ground in a truly run race. Built from decades of results, standards encode each track's personality — Catterick's downhill seven carries a far quicker one than Ascot's climb.
- The raw difference. Two seconds slower than standard might mean a weak field, slow ground or an early crawl; the remaining steps separate those explanations.
- The track variant. Known in Britain as the going allowance: an estimate, made from the whole card, of how much the day's surface and weather helped or hindered everyone. If every race came in about a second and a half slow for the known ability of the horses involved, the day itself was slow, and each time is corrected accordingly.
- Weight and age. Carrying more weight makes the same time more meritorious, so figures adjust for the weight carried — and for age, since a two-year-old in spring cannot fairly be timed against a hardened five-year-old without an allowance for immaturity.
- Everything else. The best modern figures also correct for wind on exposed straights and even for the position of the running rail, which can quietly add yards to a trip.
- The scale. Finally the corrected time becomes pounds, so it can sit beside form ratings. The judge converts time to distance at up to six lengths per second on quick Flat ground, and a length is commonly valued around three pounds in a sprint, shading to half that at middle distances — which is how a single second at five furlongs comes out at 22lb on the Topspeed scale.
To anchor the numbers: a Topspeed figure of 100 has been described as a mature horse under nine stone matching the standard time on good going in a truly run race. On Britain's pound scales generally, three figures is smart, the mid-120s is Group class, and anything pressing 140 belongs to history.
The track variant is where the craft lives
Everything in that list is arithmetic except the variant, which is judgement wearing arithmetic's clothes. The idea — use the whole day's racing to measure the day — is sound. The trouble is that one card is a small, unruly sample, and hand-made variants fail in well-known ways.
- Small cards. Six races is a tiny sample. Misjudge one and the whole day's correction moves, and every figure at the meeting inherits the error.
- A day of two halves. Rain mid-card, ground drying through a warm afternoon, a watered strip on one bend: when conditions change race by race, a single variant for the day is a fiction, and the honest answer — separate variants for separate parts of the card — is more work than one evening allows.
- One strangely run race. A crawl-and-sprint affair comes in eight seconds slow. Include it and the variant decides the ground was a bog; exclude it and you have assumed your answer before calculating it. This is the circularity problem: you need the horses' ability to measure the day, and the day to measure the horses.
- Straight and round courses. At many tracks sprints use a straight course while longer races go round turns, sometimes on different strips of ground, with the wind flattering one and punishing the other. One variant rarely fits both.
None of this makes variants hopeless. It makes them the part of the job where skill shows — and the first thing to interrogate about anyone's figures.
Reading figures like a form student
Read the cluster, not the career-best. A horse is not its biggest number. A five-year-old whose figures sit in the low 90s with one spike of 105 is a low-90s horse for whom everything once fell right. The repeatable figure is the honest one.
Watch the trajectory. The most valuable pattern on the Flat is the lightly raced three-year-old whose figures climb run by run — 78, then 85, then 92. Improving horses outrun their existing form, and figures often show it before the form book catches up.
Split by conditions. Figures earned on quick ground do not automatically transfer to soft, where a different stride and stamina profile is rewarded; plenty of horses keep two distinct figure ranges for the two surfaces. Distance matters just as much — a career-best over six furlongs is thin evidence for a mile and a quarter. Check what a figure was earned doing before assuming it travels.
Respect the freak. The most common error with figures is falling for a big number earned in a freak race shape. When the leaders go off at an unsustainable gallop and collapse, the closer who picks up the pieces records a huge figure he may never approach again: the clock rewarded the race, not the horse. This is where sectional times and pace analysis earn their keep, because they tell you whether a figure was made honestly or merely inherited.
A speed figure is what remains of the clock once the day's excuses have been subtracted — and it is only ever as good as the excuses you knew about.
Rules of thumb like these can be tested rather than trusted. Sportily's Race Lens exists for exactly that: build an angle — say, three-year-olds who set a new figure high last time — and see how it has actually fared across years of results before you lean on it.
What a speed figure cannot tell you
A figure describes what happened; it never explains why. The clock has no eyes. A horse hampered at halfway, forced wide, or given a gentle education records a modest number that says nothing about its ability, and a figure sheet will not warn you.
Tactical races, meanwhile, short-change good horses. Small-field Group races are often run at a dawdle and settled in a three-furlong dash, so the winner's figure can come out below a fair handicapper's. Timeform's own literature is candid that a timefigure reflects a single performance, frequently well below what the same horse would record in a truly run race. A great horse with a poor figure has usually met a slow pace, not a slow horse.
And figures do not travel well across eras or borders. Standards drift, timing technology changes, scales differ — an American Beyer and a British Topspeed are cousins, not twins — so comparisons across decades are parlour games rather than measurements. Even within one firm, Timeform keeps its Flat and jumps scales apart on purpose.
Used within its limits — one era, one jurisdiction, alongside the form book rather than instead of it — a speed figure is among the most honest numbers in racing. Asked to do more, it starts making things up.
Where computed figures are now
The craft has changed more in the past decade than in the previous five. GPS tracking now records sectional times across British racecourses, published through the sport's broadcasters, which means a figure no longer has to guess how a race unfolded: it can see the crawl in the first quarter mile. Sectional-aware figures can upgrade the horse that finished fastest from an impossible position, and mark down the number flattered by a collapse up front.
Variants have gone from an evening chore to a computation: modern systems rebuild them for every meeting, cross-check them against thousands of results, and fold in wind and rail positions as a matter of routine. Sportily works in this tradition — its Speed Figures are recalculated with a fresh track variant for each day's conditions and appear against every runner on its racecards, so the number you see has already had the day subtracted from it.
None of it changes the question, which is the one Phil Bull set out to answer in Halifax nearly eighty years ago: how fast is fast? The clock at Epsom on Derby day 2012 said 53.69 seconds. The figure is how you learn what that was worth.
Sportily is a statistical research platform for racing fans. It does not provide betting advice, and past results never guarantee future performance.
Ready to get started?
Want to know how fast today’s runners really went? Create a free Sportily account and you’ll see Sportily Speed Figures, adjusted for each day’s track conditions, on every racecard.
Get started →Next steps
Next, read our guide to sectional times and pace to see how race shape makes and breaks figures, then The Going Explained for the ground every variant has to measure.