 Racecourses
Draw Bias: When the Stalls Shape the Race
A number handed out at random two days before a race can decide it. This guide explains why draw bias exists, which British courses show the strongest examples, how ground and field size switch a bias on or reverse it entirely, and why the folklore is often a season out of date.
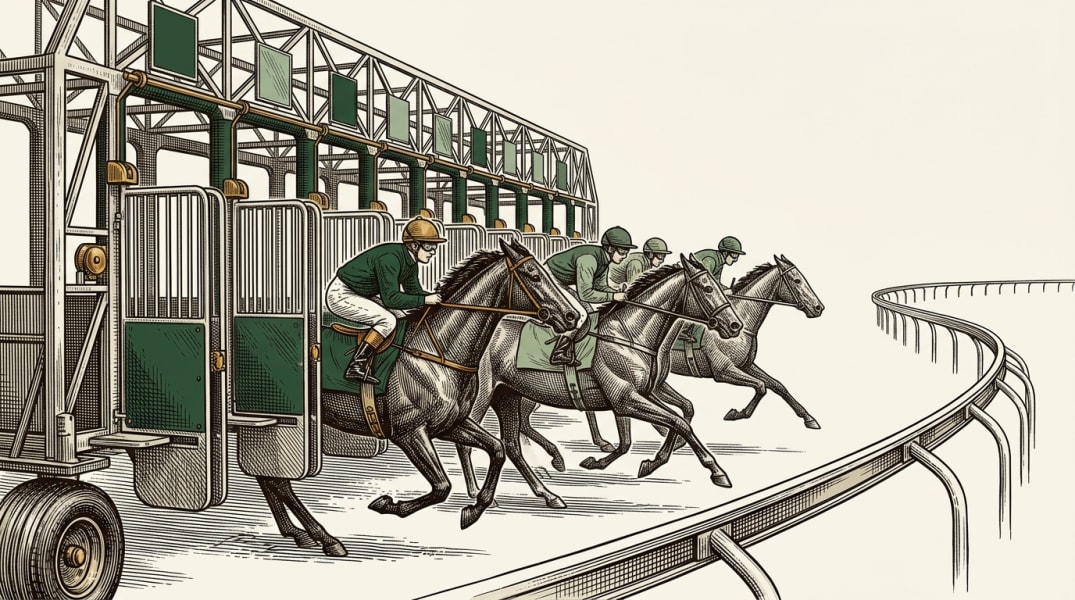
Two days before a five-furlong sprint at Chester, a computer allocates the starting stalls. The process is random, unglamorous and takes no account of ability, and yet in that moment a good deal of the race has already been decided. A horse handed stall one has been given something its rivals in stall eleven cannot buy: the shortest way round.
The draw is racing's quiet inequality. It appears on the racecard as a modest number in brackets beside each runner — flat racing only, since jump races have no starting stalls — and most of the time it means very little. At a wide, galloping, fair track over a mile and a half, a horse can be drawn almost anywhere and lose nothing by it. But at a handful of British courses, over the shortest trips, the number in brackets is among the most powerful facts on the page.
This guide covers why draw bias exists at all, where it genuinely bites, how conditions can weaken or even reverse it, and — most usefully — how to separate the biases that survive counting from the folklore that does not.
Where the advantage comes from
A draw bias is never magic. It is always geometry, drainage or traffic, and usually some combination of the three.
Track geometry is the biggest cause. Racecourses turn, and the inside of a turn is shorter than the outside. On a tight, quickly turning circuit a horse drawn on the inner can save several lengths simply by travelling the shorter route, while a wide-drawn rival covers extra ground for no reward. The tighter the turn and the sooner it arrives after the start, the less time a wide horse has to cross over and recover the loss.
The camber and the ground matter almost as much. Courses are rarely flat across their width; they drain, they slope, and after rain one strip of turf can be measurably faster than another a few yards away. Jockeys know where the better ground lies, and in soft conditions a field will often abandon the theoretical racing line altogether and make for the strip that is riding quickest — usually near a rail.
The rail itself moves. Groundstaff shift running rails to spread wear across the turf, and a rail moved out by a few yards changes the effective distance, the sharpness of a bend, and which stalls sit closest to the fastest ground. This is why a bias measured over five seasons can quietly stop being true.
Finally there is traffic. On all-weather surfaces, horses racing behind others are struck by kickback — a spray of sand in the face — and a wide draw that lets a horse race in clean air is worth having. In big fields on turf, a low draw can just as easily become a trap, leaving a hold-up horse with nowhere to go when the gaps refuse to open.
The famous cases
Chester, five furlongs
Chester is the textbook, and it earns the status. The Roodee is Britain's tightest circuit, barely more than a mile round, and its five-furlong sprints begin with a turn arriving almost immediately. There is no room to recover from a wide draw and no straight worth the name in which to try. Analyses of the course have found roughly 63 per cent of five-furlong winners emerging from stalls one, two and three — a share far beyond what those stalls' runners would earn by chance.
Chester also illustrates the most important caveat in this whole subject: biases are not permanent. Since the introduction of a false rail at the top of the short home straight, the effect has softened. High draws still struggle badly, but middle draws have in recent seasons won at rates close to the low ones. The folklore says stall one; the current data says avoid the high numbers, which is a different and more useful statement.
Beverley, five furlongs
Beverley's sprint course is a lesson in reading mechanisms rather than memorising rules. The five furlongs begin on a spur, bend right through a pronounced dog-leg around halfway, and run on ground that slopes down from the inside rail. A widely drawn horse is therefore doing two unhelpful things at once: travelling further to reach the turn, and climbing slightly to get there. On fast ground, low draws are strongly favoured, and the advantage grows as fields get bigger.
Then it rains, and the whole thing turns over. On soft or heavy ground the bias at Beverley can reverse outright, because the field abandons the geometric racing line and heads for the near-side rail, where the ground rides best. A form student who memorised "low draws at Beverley" and stopped there will be confidently wrong on exactly the days when the mistake costs most.
A draw bias is not a property of a racecourse. It is a property of a racecourse on a particular day, with the rail in a particular place and the ground riding a particular way.
Bias is conditional, not constant
Everything above generalises into four conditions worth checking before you let a draw influence your reading of a race.
- Field size. A bias needs runners to bite. In a six-runner sprint everyone can take a sensible position and the draw barely matters; in a sixteen-runner cavalry charge the wide horses are pinned wide and the effect can be brutal. Many published draw statistics quietly average both situations together and understate the extremes.
- The going. Ground moves the fastest strip and can, as at Beverley, flip the bias entirely. Always read the draw alongside the day's official going — our guide to the going explains how much the ground rewrites.
- The rail position. A moved rail resets the geometry. Historical numbers gathered before the move describe a track that no longer exists.
- Pace. The draw sets where a horse starts; the way the race is run decides whether that matters. A confirmed front-runner drawn wide can cross over and lead, spending a little energy to erase the disadvantage entirely, while a hold-up horse drawn low may be buried on the rail with nowhere to go. Draw and run style have to be read together, which is the argument of our guide to sectional times and pace.
Folklore, data, and where the edge actually lives
Racing folklore is generous with biases. Every regular at every track knows one, and a large share of them evaporate the moment somebody counts properly. Three traps recur.
The first is small samples. A course may stage a dozen five-furlong handicaps a year. Three seasons of data is thirty-six races, and thirty-six races cannot reliably separate a genuine advantage from a run of luck. The honest test is a simple one — split the draw into thirds, low, middle and high, and compare win rates and top-3 finish rates across a long run of races, always noting the sample size beside the percentage.
The second is survivorship: the dramatic bias that everyone remembers because it produced three astonishing results, and nobody remembers the seasons in which it did nothing.
The third, and the most important for anyone hoping to gain something from all this, is that the famous biases are already priced. Chester's low-draw advantage is not a secret. It has been written about for decades, and the market at Chester reflects it: the low-drawn horse is shorter in the market precisely because everybody knows. One draw-bias resource makes the concession explicitly, noting that its findings are already built into the prices on offer.
Which means the value, if there is any, lives in the second-order material. When does the bias switch off — small fields, soft ground, a moved rail? Which horses are wrongly discounted for a wide draw when their run style makes the draw irrelevant? Has a course quietly changed, as Chester has, so that the folklore is now a season or two behind the truth? Those questions are answerable, and they are answerable by counting rather than by inheriting an opinion.
Checking a bias for yourself
The old way to test a draw theory was to spend a winter with a shelf of form books. The modern way is a filter. In Race Lens you can pin a course, a distance, a going band and a field-size range, split the results by draw, and read the historical win rate and top-3 finish rate — with the sample size in plain view, which is the number that keeps the exercise honest.
Two disciplines make the difference between analysis and self-deception. Decide what you are testing before you look, because a database deep enough will eventually hand you a stunning pattern that exists only because you went looking for stunning patterns. And check any angle against seasons it was not built on. A draw bias that works everywhere except the years you did not examine is not a bias; it is a coincidence with good manners.
The summer test
Nowhere is any of this more visible than in the great summer sprint handicaps, when twenty-odd horses line up across the width of a track and the draw stops being a footnote. The Coral Stewards' Cup, run over Goodwood's six furlongs on the final day of the Qatar Goodwood Festival, is the classic example: a full field on a switchback downland course, where fields habitually divide into groups and the question of which group has chosen the right ground is not settled until the closing stages. York's big sprints during the Ebor Festival ask the same question of a very different, far fairer track — one reason York form is so widely trusted. Our tour from Glorious Goodwood to the Ebor covers both meetings in full.
Watch one of those races with the draw in mind and the shape of it changes. You stop seeing twenty horses and start seeing two or three groups, each backing its own judgement about where the ground rides best, each led by a jockey who walked the course that morning. The stalls handed out their numbers at random two days earlier. What the riders do with them is not random at all.
Sportily is a statistical research platform for racing fans. It does not provide betting advice, and past results never guarantee future performance.
Ready to get started?
Think a course bias has faded, or only bites in big fields on fast ground? Split any course and distance by draw in Race Lens and read the real historical record, sample size included. A free Sportily account gets you started.
Get started →Next steps
Read Sectional Times and Pace next to see how run style can cancel a bad draw, then The Going Explained for the ground that decides which strip rides fastest.