 Form & Data
Sectional Times and Pace: How Races Are Really Won
Two races can share a winning time yet tell opposite stories. This guide explains sectional times and pace analysis in British racing: how GPS tracking ended the stopwatch era, how run styles shape results, why collapses and crawls distort the form book, and what finishing speed really reveals.
Picture two races at York over the same mile and a quarter, and imagine the clock catching both winners in exactly two minutes and six seconds. On paper they are twins. In reality, one race was run at an honest, even tempo from the moment the gates opened; the other crawled for half a mile while the jockeys eyed each other, then turned into a three-furlong dash. The first winner stayed every yard of the trip. The second may simply have been handiest in a sprint that began a long way from home.
The form book treats those two winners identically. A furlong, for newcomers, is 220 yards, about 200 metres; British races are measured in them. The clock can tell you a race consumed 126 seconds. It cannot tell you where those seconds were spent, and that is precisely where performances are made and unmade.
For most of British racing's history, nobody could see inside a race at all. Over the past decade that has changed: GPS sensors in number cloths, sectional times for every British course, live graphics on terrestrial television. The analytics wave that reshaped football and cricket has finally reached the sport that invented form study. This guide explains what sectional times are, how pace decides races, and how to use both to read results more honestly.
The story a finishing time hides
A finishing time is one number summarising a journey of many parts, and the parts are where the truth lives. Every race distributes its energy differently. Some are run efficiently, the field clicking through near-identical furlongs from start to finish. Others are wildly lopsided: a breakneck opening quarter followed by a procession of exhausted horses, or a dawdle that ends with twelve runners sprinting flat out.
The consequences for interpretation are enormous. Two performances of near-identical merit can be separated by several seconds on the clock; two performances several seconds apart can be worth the same. A horse beaten five lengths may have run the best race of its life; a horse winning by five may have been handed the race by the way it unfolded. Time analysts call this the shape of a race, and until you know the shape, a bare result is a rumour rather than a fact.
What sectional times actually are
A sectional time is simply the time for one segment of a race — furlong by furlong where the tracking allows — recorded for every horse individually rather than just the leader. From sectionals you can reconstruct the whole story: who went hard early, who was travelling strongly at halfway, who finished fastest and from where.
None of this is new elsewhere. Hong Kong has published official sectional times and running positions for every race for decades, and form students at Sha Tin and Happy Valley treat them as basic equipment. American racing has printed fractional times — leader-based splits at fixed calls such as the quarter-mile and half-mile — in its official race charts for well over a century. Britain, by contrast, long relied on the stopwatch under the trilby. Phil Bull, the Yorkshire mathematician who founded Timeform in 1948, built his early ratings partly on hand-held stopwatch timings, and generations of enthusiasts after him clicked away at television replays because the sport supplied nothing better.
The change came with satellite tracking. On 19 December 2015, a horse called Zeeoneandonly won the 12.05 at Lingfield under Adam Kirby carrying a small GPS sensor in his number cloth — the first British winner clocked by Total Performance Data's system. By 2018, Arena Racing Company was offering sectional timing at every one of its fixtures, roughly 600 a year, the first large racecourse group in the world to do so, and the data was published free on At The Races, colour-coded against par and extended to jumps racing in 2019. In July 2024 the last gap closed: an industry agreement combined Total Performance Data's coverage with Coursetrack's GPS tracking of Racecourse Media Group's 35 courses — Cheltenham, Epsom, Newmarket and York among them — creating a single sectional database for all 59 British racecourses. RaceIQ, launched in 2024, now pipes sectional insight into ITV Racing's and Racing TV's coverage, and the tracking reaches Irish racecourses too. Graphics that did not exist on British screens ten years ago are now part of the furniture.
Run styles and the pace map
Knowing the splits after a race is useful. Anticipating them before it is better still, and that starts with run styles — the habitual early positions horses take. Racing shorthand recognises four: front-runners, who want to lead; prominent racers, who track the leaders; midfield types; and hold-up horses, settled near the rear to be produced with one late run. Horses are creatures of habit, and a glance through the comments-in-running attached to old form — "made all" (led throughout), "prominent", "held up in rear" — tells you which kind you are dealing with.
This matters because a race is not a time trial on a treadmill. It is run at whatever tempo the runners' habits and their riders' intentions produce, and the fastest horse wins only when the shape allows. Before any race you can sketch a mental pace map in thirty seconds. Count the confirmed front-runners. If there are none, expect a steady early tempo that suits those ridden close to it and strands anyone needing a strong gallop to run at. If there are three or four, a duel is likely, and the race may set up for the closers. A hold-up horse in a five-runner race with no natural pace faces a task no ability rating can capture; the same horse in a twenty-runner cavalry charge with three trailblazers may get exactly the collapse it needs.
Three pace shapes and what they do to the form book
Most races fall, roughly, into one of three shapes, and each leaves a different fingerprint on the results you read afterwards.
The even gallop
The fairest race: an honest tempo throughout, energy spent efficiently, sectionals flat and unremarkable. Finishing order sits close to true merit, and the form can generally be trusted at face value. These are the races you can move past quickly.
The collapse
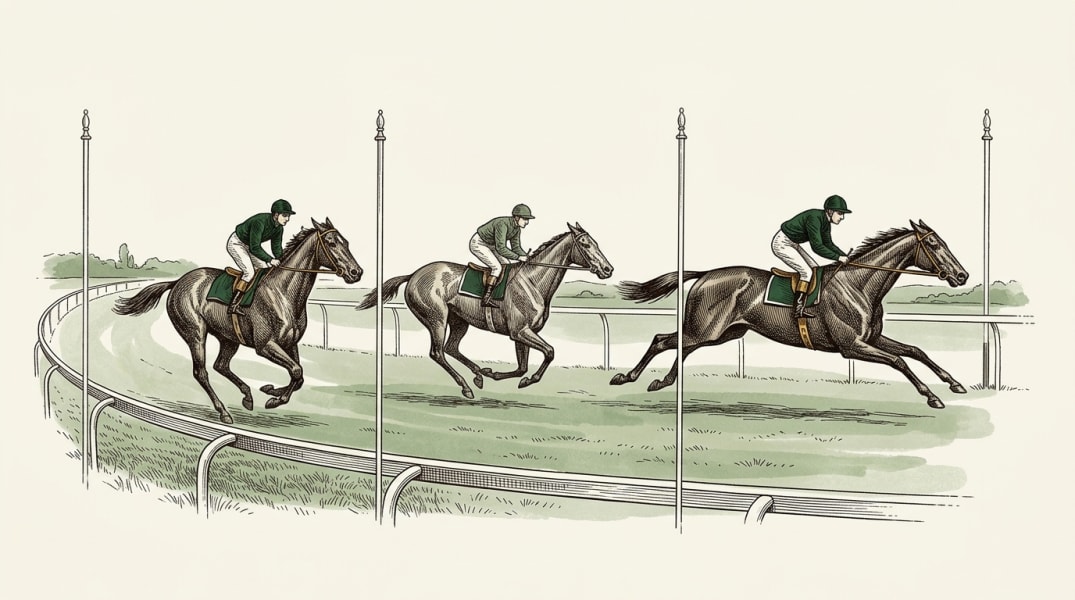
Two or three front-runners take each other on, the opening furlongs are overcooked, and the leaders spend the closing stages decelerating while the patiently ridden horses sweep past. The classic habitat is the big-field sprint handicap — a handicap being a race in which better horses carry more weight to level the contest. Here the winner is often flattered, towed into a race that died in front of it, while the beaten trailblazers may be far better than the bare result: they did the work that created the finish everyone else exploited. The form book records them as also-rans; the sectionals record them as the engine of the race.
The crawl-and-sprint
Nobody commits, half the race is run at a hack canter, and the contest becomes a two-furlong scramble. This shape flatters whoever was closest to the front when the sprinting began and makes hold-up horses look unlucky, though it is mostly an illusion: late gains against horses never fully extended are cheap gains. A closer flying home into a crawl has often achieved very little; a closer making the same ground into a strong, honest pace has usually achieved a great deal.
The 2011 2000 Guineas at Newmarket shows how much shape normally matters by showcasing the one horse it did not matter to. Tom Queally let Frankel bowl along in front, and the colt was double-digit lengths clear at halfway — a textbook collapse script, the kind of early extravagance that swallows ordinary horses in the final furlong. Frankel simply kept going and won by six lengths, the widest margin in the race since Tudor Minstrel in 1947. For every Frankel, the form book holds a hundred tearaways caught in the shadow of the post.
A result records where each horse finished; the pace decides what that finish was worth.
Finishing speed: reading the late splits
The most useful single number to emerge from sectional analysis is finishing speed — a horse's speed over the final section of a race expressed as a percentage of its average speed for the whole race. Timeform, whose method was devised by the sectional specialist Simon Rowlands, uses the last two furlongs in races up to a mile and the last three beyond. A figure of 100 means a horse finished at exactly its average speed; above 100, it was finishing faster than it had travelled overall.
Crucially, "normal" varies by course and distance. Timeform's guide puts par for Epsom's Derby trip at around 111 per cent, because the stiff early climb and easy run home mean every horse finishes faster than its race average, while Sandown's uphill Eclipse finish drags par down to roughly 94 per cent. Reading finishing speed means reading it against the par for that track and trip, not against a universal ideal.
Used that way, it can be genuinely predictive. Golden Horn won the 2015 Derby in the best relative time of the season to that stage while recording an above-par finishing speed — energy in reserve — and Timeform's analysts suggested there was more to come. He proceeded to take the Eclipse and the Arc. But a spectacular late split is not automatically brilliance: a very high finishing speed usually means the race was slowly run, so the figure describes the race as much as the horse. The reverse holds too. When Shishkin edged Energumene in their famous Clarence House Chase duel at Ascot in January 2022, the eye saw the winner quicken heroically after the last fence. The sectionals, analysed in At The Races' Sectional Spotlight, saw something else: the final two furlongs were run at 96.6 per cent of race speed against a par of 99.7 — nobody was quickening at all. Energumene was simply wilting fractionally faster than Shishkin. Analysts call this a horse "running to conditions": no horse can finish fast out of a race that has already emptied its legs.
The practical craft: upgrading and downgrading form
Watch replays with the shape in mind — most sectional-era racecards and replay services now show the splits — and ask three questions. Was the early tempo honest? Who did the donkey work? And who finished fastest, and did the shape make that easy or hard?
- Upgrade horses that forced or chased a collapse and faded late — their finishing position understates their contribution — and closers that made significant ground into an honest, sustained gallop, which is the most demanding way to pass horses.
- Downgrade winners handed a soft, uncontested lead in a crawl, and eye-catching late finishers in a crawl-and-sprint, whose gains came against half-extended rivals.
- Note the venue. Sharp, tight-turning tracks reward early speed structurally. Chester, with its short straight and near-circular circuit, is the famous example: front-runners win roughly three in ten of its five-furlong races — far more than raw chance would suggest — and low-drawn early leaders do better still, while hold-up horses simply run out of track. How starting positions feed that effect is covered in our guide to draw bias.
The final step is to test an idea rather than trust it. If replay-watching convinces you that front-runners are underrated in five-furlong handicaps at sharp tracks, that is a hypothesis — and hypotheses are for checking. Sportily's Race Lens exists for exactly this: build an angle from dozens of filters, run style included, and test it against years of history in seconds rather than spending a winter with the form books.
Where this is going
The next stage is already visible: ratings and models that know the shape of a race. A conventional speed figure treats the clock as the whole truth, which is why sectional-aware ratings are such an upgrade — they can stop penalising closers trapped in crawls and stop flattering leaders gifted soft races. Sportily's own Speed Figures already adjust raw times for each day's track conditions, and sectional data extends that same correction inside the race itself; the journey from stopwatch to speed figure is told in Speed Figures Explained. Fold run style, pace shape and finishing speed into a model and you begin to predict not just how good horses are but how the race will actually be run — the frontier explored in Can Data Predict a Horse Race?
Hong Kong shows the destination: a racing culture where sectionals are as unremarkable as the results themselves. Britain now has the data; the craft of using it is spreading fast. None of it retires the human eye — a replay still tells you things no spreadsheet can — but the clock has finally been promoted from witness to expert witness. The races were always won and lost in the parts. Now, at last, we can see them.
Sportily is a statistical research platform for racing fans. It does not provide betting advice, and past results never guarantee future performance.
Ready to get started?
Think front-runners are underrated at sharp tracks, or that hold-up horses need a stronger test? Build a run-style angle with Race Lens and check it against years of history in seconds — a free Sportily account is all it takes.
Get started →Next steps
Continue with Speed Figures Explained to see how raw times become ratings, then read our Draw Bias guide to learn where track geometry hands early leaders their head start.